President Trump enters the 2026 midterms with a 40 percent approval rating, and the final NBC poll before Election Day shows economic dissatisfaction at levels the survey has not recorded in more than 30 years. Those are the headline numbers. What they mean depends on which number you are reading, because each one measures something different.
This piece turns the poll's published figures into a short reading guide. The data comes from NBC News's final pre-election survey, presented by chief data analyst Steve Kornacki on Sunday's episode of "Meet the Press" and reported by AOL. Every figure below traces to that poll. None of it predicts an outcome; it maps what voters were telling pollsters in the days before Tuesday.
What does the 40 percent approval rating actually measure?
Approval measures how voters rate the president, not how they will vote. The poll put Trump's pre-election approval at 40 percent, down from where it stood going into his first midterm in 2018, according to Kornacki. He tied that decline to the economy: in 2018, he noted, "nearly 70% of voters on the eve of that midterm were satisfied" with the economy. That satisfaction is gone now. Readers following this should also see Section 1071 Small-Business Lending Rule: What Lenders Must Track.
The practical step for a reader is to separate the two numbers. Approval is a thermometer for the president. It does not by itself tell you which party wins seats, because voters can disapprove of a president and still back that president's party on the issues they care about most. The poll itself shows why: respondents still rated the Republican Party better on the economy, government corruption, and immigration, even while disapproving of the president.
Why does the 51 percent personal-finance figure matter?
The 51 percent dissatisfaction with personal finances is a record for this poll, and that is the number to watch. Kornacki said it is "the first time in over 30 years of the NBC poll that the dissatisfaction number has been at that level, has been a majority." On the broader economy, nearly three quarters of respondents — 73 percent — said they were dissatisfied with the effects of the affordability crisis.
For a voter reading coverage this week, the check is simple: when a story cites economic sentiment, ask whether it refers to the economy overall or to personal financial situations. The poll measured both, and they moved together here, but they are separate questions. Personal-finance dissatisfaction at majority level is the rarer and more pointed signal in this dataset.
How should you read the party-by-issue comparisons?
The issue-trust numbers show movement, not verdicts. Respondents gave Democrats a one-point edge on inflation and a two-point edge on the economy. Kornacki framed the scale of the shift: inflation "was, like, a 20-point advantage for Republicans just a couple years ago as Trump was returning to the White House." He added that for the economy numbers "to even be close, that represents ground gained by Democrats."
Read those margins as direction, not magnitude. One and two points sit inside any poll's margin of error, so the defensible takeaway is the trend against the historical baseline, not the current edge itself. Respondents still preferred Republicans on the economy broadly, government corruption, and immigration, while preferring Democrats on the war with Iran and inflation. Both halves of that list belong in any honest reading.
What is the one number that cuts the other way?
Party image is the counterweight, and it favors neither side cleanly. Kornacki identified it as the number Republicans would point to: their favorable-unfavorable rating is "about where it was in 2018." The Democratic Party, by contrast, stood at only 29 percent favorable in this poll.
He framed the open question directly: in 2018, Democrats "were positioned to take votes from voters who were dissatisfied with Trump," and the question heading into Tuesday is whether the party's lower favorability now prevents it from capitalizing on the other numbers. For a reader, this is the figure that complicates every simple narrative built on approval alone.
What can a voter actually do with these numbers before Tuesday?
A short checklist, grounded in what the poll does and does not contain:
- Match each number to its question. Approval (40 percent), economic satisfaction (73 percent dissatisfied), personal finances (51 percent dissatisfied), and party image (29 percent favorable for Democrats) measure four different things.
- Treat small margins as trends. The one- and two-point Democratic edges on inflation and the economy matter because of the 20-point Republican lead they reverse, not on their own size.
- Note the timing. These are final pre-election figures from a poll presented the Sunday before Tuesday's vote; they are a snapshot, not a result.
- Watch which numbers campaigns emphasize. Kornacki's own framing — that party image is the number Republicans would point to — shows how the same dataset supports different arguments.
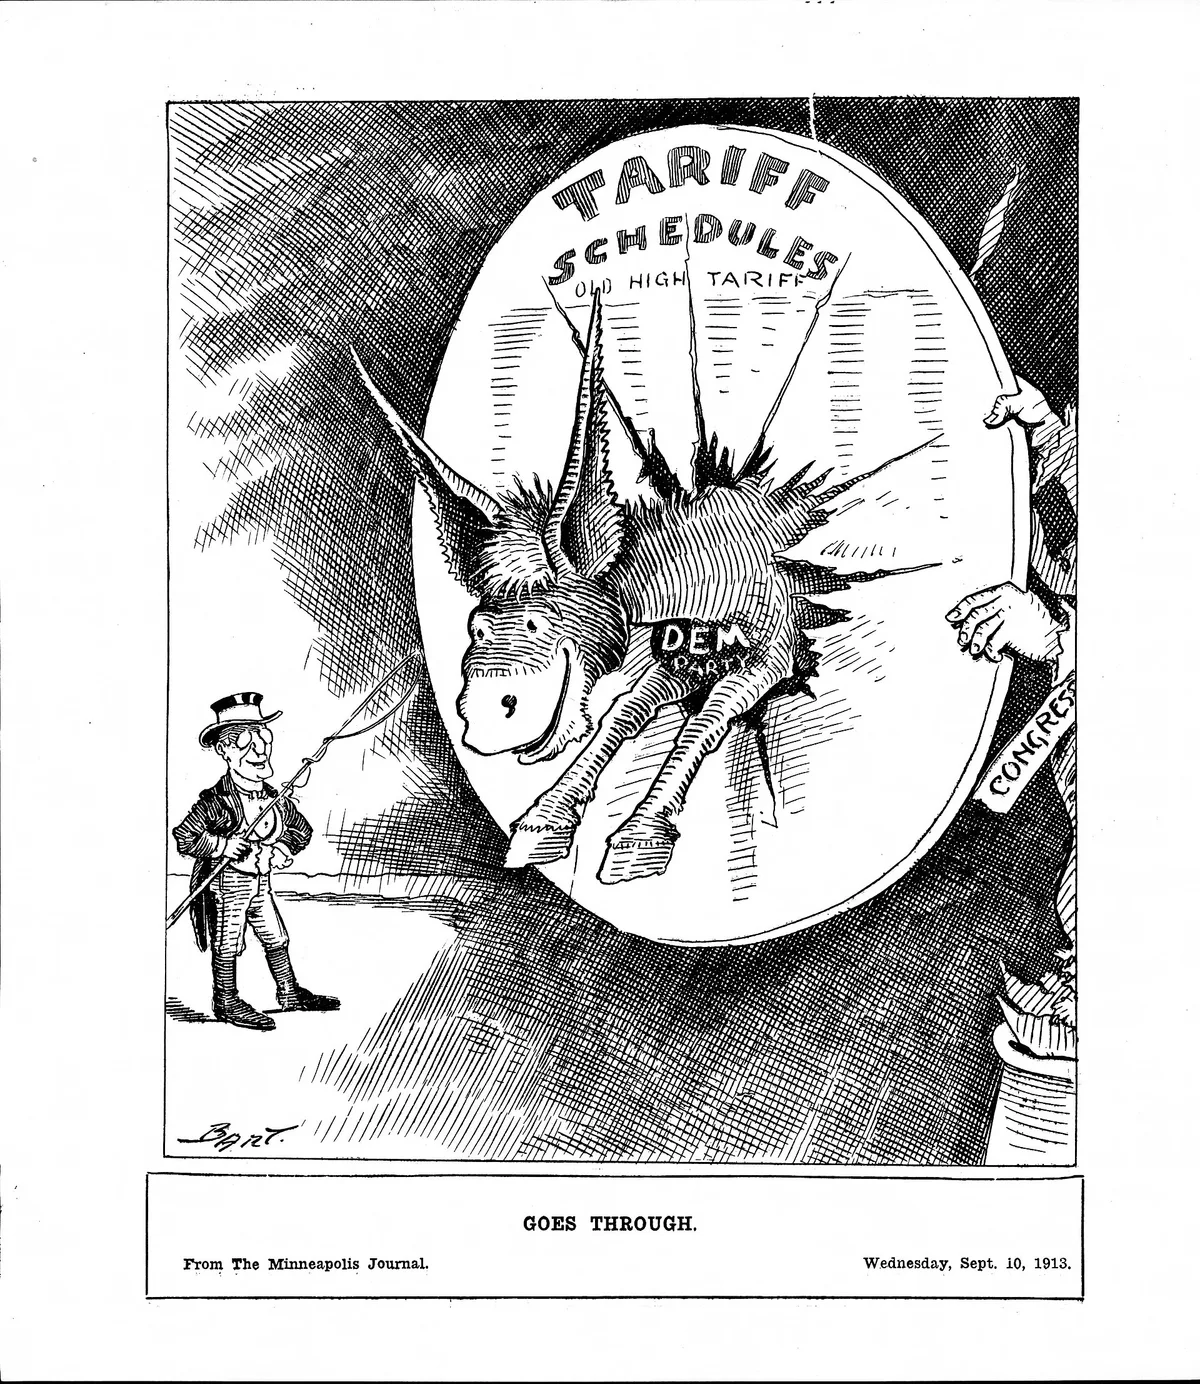
For more on how economic policy feeds these sentiment numbers, see our coverage of how import duties reach the price you pay, and our running business news section. Broader pre-election process coverage sits in our elections news desk, and longer readings of political data in our analysis section. We covered a connected angle in Tariff Pass-Through: How Import Duties Reach the Price You Pay.
What remains unknown is the thing polls cannot supply: how these sentiments convert into votes on Tuesday. The poll established where voters stood in the final days. The count will establish everything else.